
Complete Guide to Western Price Bar Analysis for Beginners
By Yogesh Alim,Yogesh Alim Academy
Have you ever looked at a stock chart full of thin vertical lines and small side ticks and wondered what on earth they mean? You are not alone. Every trader who opens a terminal for the first time stares at those bars and feels a little lost, and that is exactly where Western Bar Chart Analysis for beginners becomes a game-changer
Here’s the thing — once you understand the four simple price points hiding inside every bar, you will never look at a stock chart the same way again. In this guide, we will break down the Western Bar Chart step by step, using real Indian market examples in rupees, so that by the end you can read price action like someone who has been doing this for years.
Table of Contents
What Is a Western Bar Chart?
A Western Bar Chart is one of the oldest and most trusted tools used by professional traders around the world to study price movement. Instead of using colourful candle bodies,
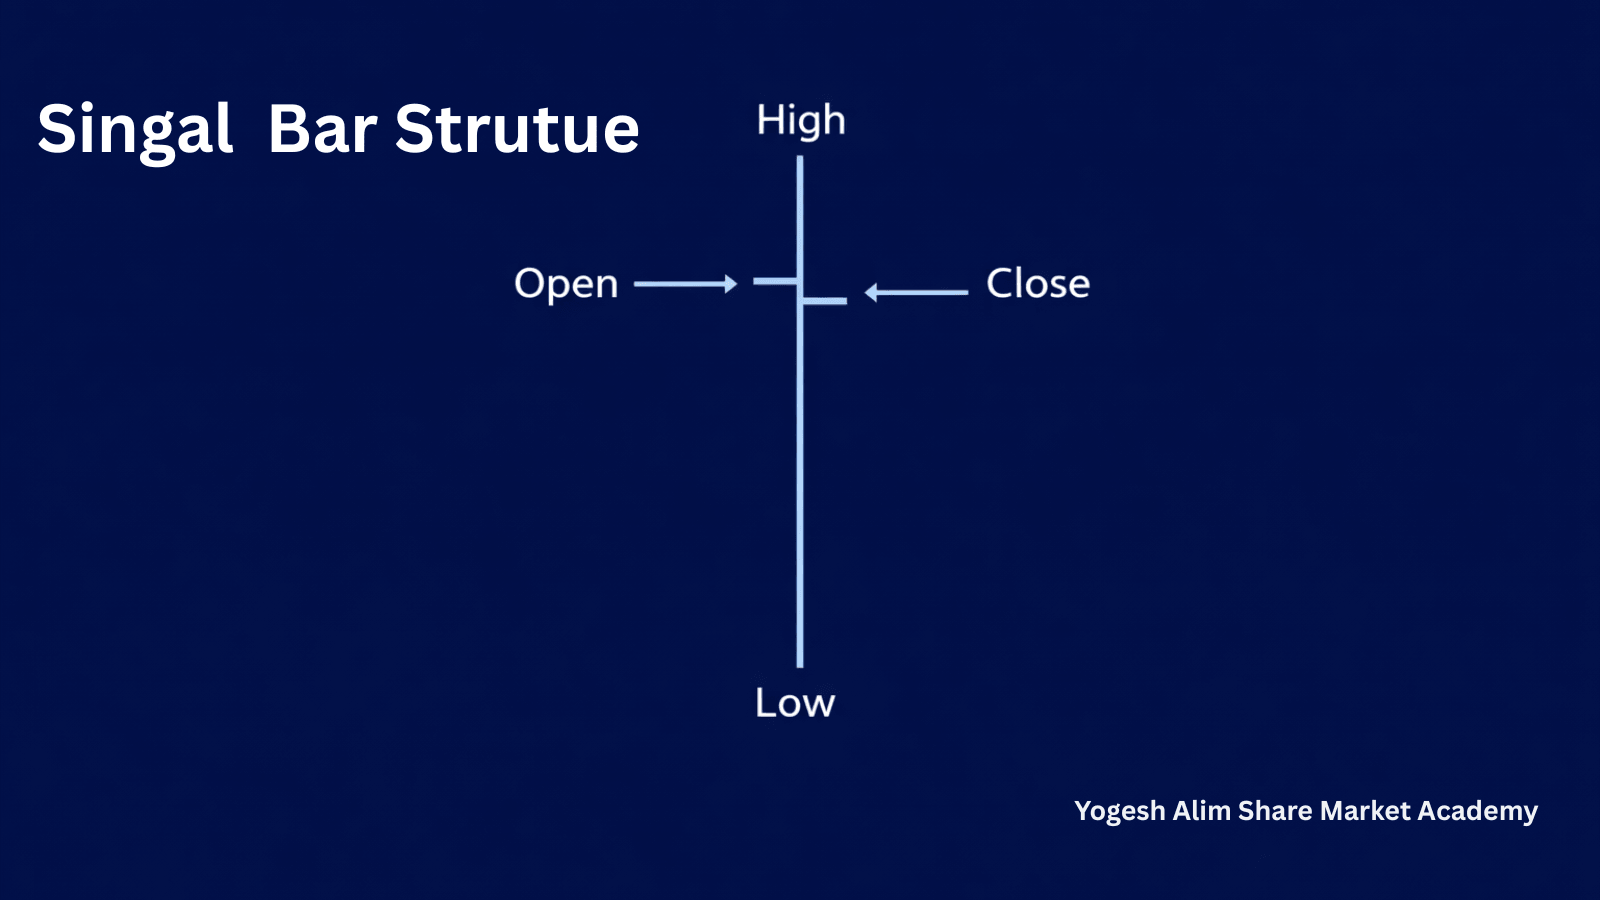
it uses a simple vertical line with two small horizontal ticks — one on the left and one on the right — to capture the entire story of a trading session in a single glance.
Each bar packs in four crucial pieces of information: the price at which trading opened, the highest price touched, the lowest price touched, and the price at which trading closed. Once you know how to decode these four points, you can judge whether buyers or sellers were in control during that period — without needing a single indicator.
Pro Tip from Yogesh Alim:
Most beginners jump straight to indicators like RSI or MACD before they can even read a plain price bar. Master the bar first — the indicators will make a lot more sense afterward.
If terms like demat account or order types still feel unfamiliar, it’s worth building that foundation first with our Basics of Share Market Course before moving further into chart reading.
Types of Charts: Line vs Candlestick vs Western Bar Chart
Before you commit to one style, it helps to know your options. Every trader in India eventually chooses between three popular chart types:
Line Chart
connects only the closing prices over time. Simple and clean, but it hides the high, low, and open of each session
Candlestick Chart
shows open, high, low, and close using colour-coded bodies, making patterns easy to spot at a glance.
Bar Chart
displays the same four price points using a vertical bar with side ticks, forcing you to read price structure rather than rely on colour
So why should you learn the Western Bar Chart instead of jumping straight to candlesticks? Because bar charts train your eye to focus on the actual numbers — open, high, low, close — rather than on colour alone. Traders who start with bar charts often develop a sharper sense of price action, which makes reading candlestick charts even easier later on.
This is exactly the sequence we follow in our Technical Analysis Course — plain price bars first, patterns second.
Once you’re comfortable reading bars, you’ll find candlestick charts almost intuitive — we’ve broken those down separately in our free pdf guide on Candlestick Chart Patterns for Beginners
The Four Parts of a Price Bar: Open, High, Low, Close.
OPEN
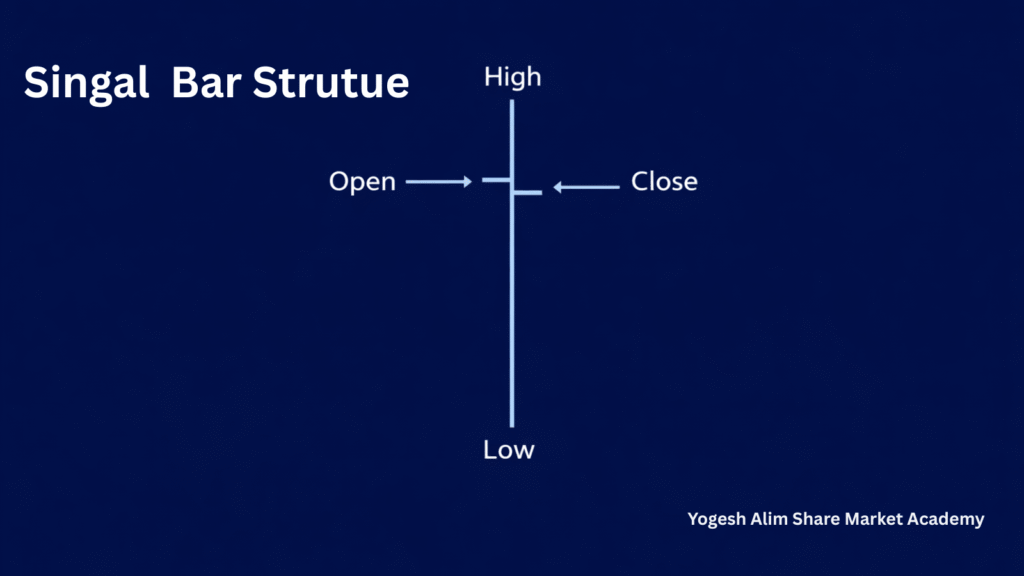
The price at which the session begins, marked by a small tick on the left side of the bar.
High Price
The highest price reached during the session — this sits at the very top of the vertical bar.
Low Price
The lowest price touched during the session — this sits at the bottom of the vertical bar.
Close Price
The final price at the end of the session, marked by a tick on the right side of the bar. This is arguably the most important of the four.
Expert Insight
Mastering these four price points — Open, High, Low, and Close — is the real foundation of reading any Western Bar Chart like a professional. Everything else builds on this.
Bar Anatomy: Buying Body, Selling Body and Total Range
A single bar can be broken down into three segments, and understanding them tells you exactly who was winning the tug-of-war between buyers and sellers:
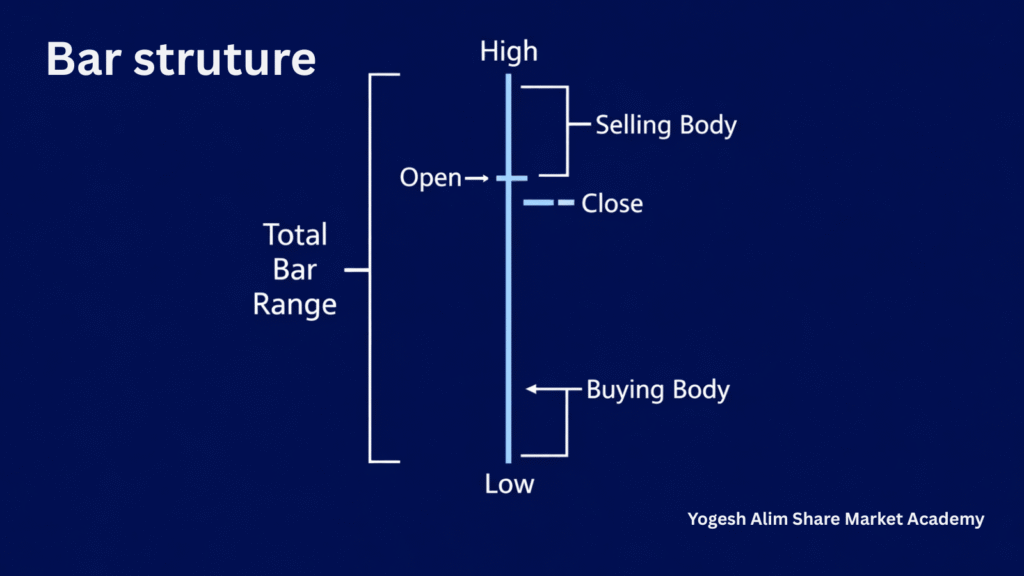
- Total Range — the distance from the Low to the High. This shows the full price movement during the session.
- Buying Body — the distance from the Low to the Close. A larger buying body means buyers pushed price up and held their ground.
- Selling Body — the distance from the High to the Close. A larger selling body means sellers dragged price down and kept it there.
The relationship between the buying body and the selling body is what ultimately tells you whether buyers or sellers dominated that period — and that single insight is at the heart of Western Bar Chart Analysis for beginners
Types of Bars: Bullish, Bearish and Neutral
Bullish Bar
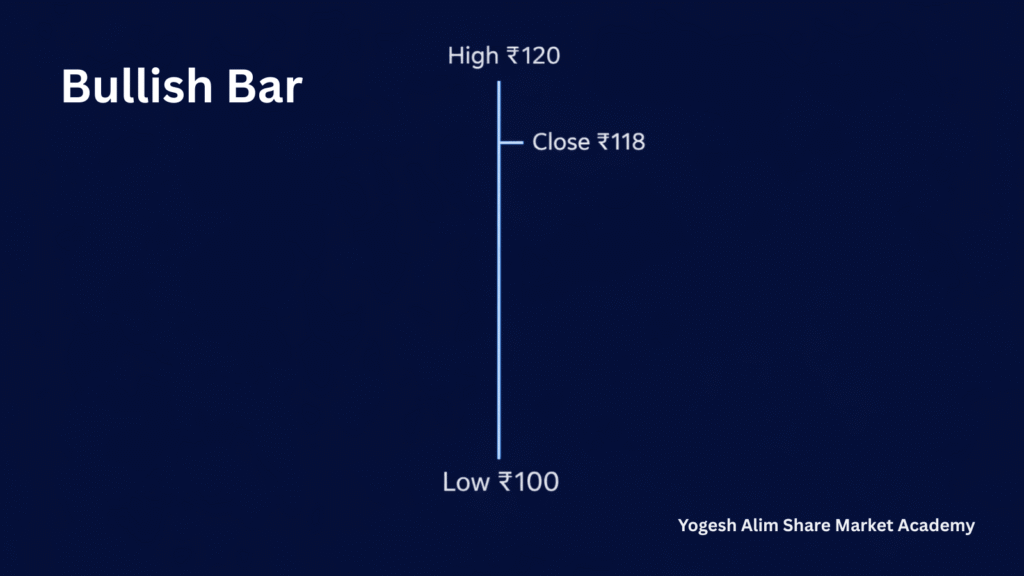
A bullish bar forms when the buying body is bigger than the selling body, and the close sits near the high. It signals that buyers pushed price up and successfully held it near the top of the range.
- Buying Body greater than Selling Body
- Close is near the High
- Buyers are clearly in control
Bearish Bar
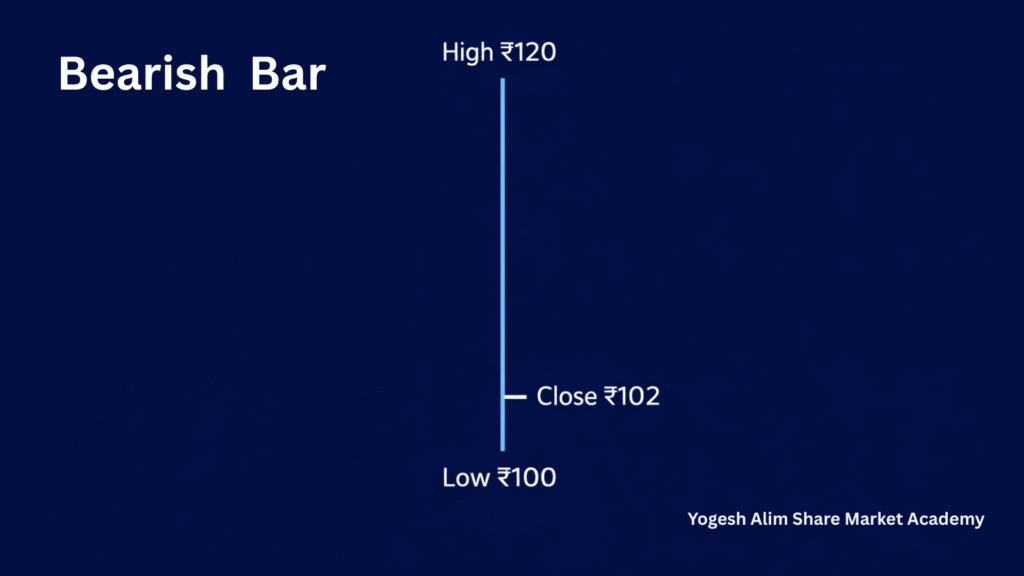
A bearish bar is the opposite. The selling body dominates, and the close sits near the low, showing that sellers were firmly in charge.
- Selling Body greater than Buying Body
- Close is near the Low
- Sellers are clearly in control
Nutral Bar
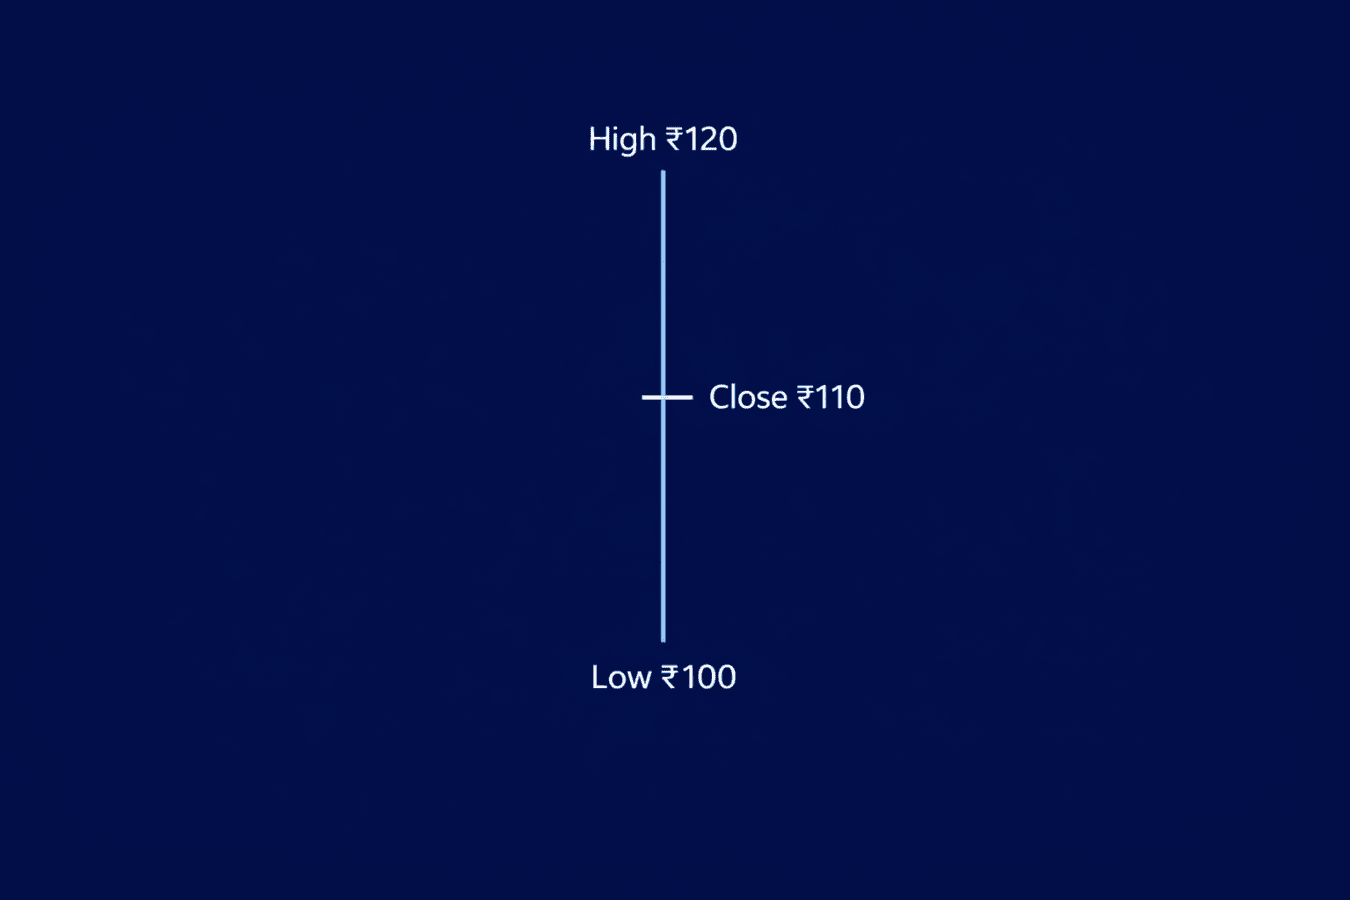
Sometimes neither side wins. When the buying body and selling body are roughly equal and the close lands in the middle of the range, the market is indecisive and waiting for a fresh trigger.
- Selling Body and Buying Body is almost equal.
- Close is near to midle of Range.
- Neither side wins.
How to Read a Western Bar Chart: Real ₹ Examples
For instance, let’s use two simple, realistic examples — the kind of price action you might see on an Indian large-cap stock like TCS, Reliance, or Infosys on any trading day.
Example 1: Strong Bullish Bar
| Metric | Price |
|---|---|
Low Price | Rs. 100 |
High Price | Rs. 120 |
Close Price | Rs. 118 |
Here, the close of ₹118 is very near the high of ₹120. The buying body is large, and the selling body is tiny — a clear sign that buyers were firmly in control for that session.
Example 1: Strong Bearish Bar
| Metric | Price |
|---|---|
Low Price | Rs. 100 |
High Price | Rs. 120 |
Close Price | Rs. 102 |
This time, the close of ₹102 sits very close to the low of ₹100. The selling body is large, and the buying body is small, telling you that sellers dominated the session and pushed price down hard.
You can see this same OHLC structure on live charts for any NSE-listed stock directly on the NSE India website.
Pro Tip from Yogesh Alim:
Bigger body, stronger conviction. A large buying or selling body means one side dominated with real strength. A small body means neither side pushed hard, and the market lacks conviction — treat these bars with caution.
Core Rules Every Beginner Must Follow
When you are just starting out, it is easy to get distracted by the wrong details. Keep these four rules in mind every time you look at a bar chart:

Ignore Bar Colour
colour is cosmetic and does not define strength on a Western Bar Chart.
Ignore the Open Price Bar
The open matters far less than where the session eventually closed.
Focus on the Close Price
The close reveals the market's final decision for that session.
Focus on Body Size
A bigger body reveals stronger conviction from buyers or sellers.
Once these four rules feel second nature, it’s worth checking how much of the bigger picture you’ve actually absorbed. You can test your fundamentals with our Free NISM Mock Test — it’s a good way to spot gaps before you start trading with real money.
Applications and Common Mistakes in Western Bar Charts
Applications
Western Bar Charts are versatile enough to be used across almost every trading style in the Indian markets:
- Intraday Trading — making quick decisions on short-term price movements within a single day.
- Swing Trading — capturing multi-day trends with precision by reading a sequence of bars.
- Nifty Options Trading — applying time-sensitive strategies for index options using bar structure.
Beyond timeframes, traders use bar charts to identify trends early, pinpoint precise entry and exit levels, and gauge overall market sentiment through the shape of each bar.
If Nifty options trading is where you’re headed next, our Futures & Options Course builds directly on this same bar-reading foundation with strategies built for derivatives.
Common Mistakes
However, even with the right knowledge, many new traders in India still misread bar charts. Here are the three most common errors — avoid them from day one:
The best way to build real fluency is to open a live chart — platforms like Moneycontrol let you toggle between bar, candlestick, and line views on the same stock — and practice spotting bullish and bearish bars for yourself.
- Focusing on Colour — colour is secondary; price action and body size matter far more.
- Ignoring the Close Price — the close reveals who actually
- Overcomplicating the Chart — piling on too many indicators clouds judgment. Simplicity leads to clarity and better trades.
If traders avoid these common mistakes while trading, their trading will become much easier than before.

Learn Western Bar Chart Analysis with Yogesh Alim Share Market Academy
The Western Bar Chart Mastery course is built on three core pillars
What You 'll Learn
- Step-by-Step Strategy
- Live Market Examples
- Risk Management
For broader investor protection guidelines and free educational material, you can also explore SEBI’s official website
You might be wondering what you will actually walk away with. Here’s what the course covers:
- Entry and exit rules for confident trade execution
- Trend identification to read market direction accurately
- Intraday strategy for day-trading setups that actually work
- Real trade setups drawn from live examples in the market
Ready to Start Your Trading Journey?
Join the Western Bar Chart Mastery course and learn from a trainer with 10+ years of live market experience.
Join Our Western Bar Chart Mastery CourseFrequently Ask Questions
Yes, the basics of Western Bar Chart Analysis can be self-taught through practice and observation. However, structured guidance from an experienced trainer like Yogesh Alim helps you avoid common beginner mistakes and speeds up the learning curve significantly.
You can open a demat and trading account with brokers like Zerodha or Upstox with a small initial deposit, and some brokers allow you to start with just a few thousand rupees. However, it is wiser to first learn chart reading and risk management before committing real capital.
No single chart type guarantees higher profits. Bar charts, candlesticks, and line charts all display the same underlying price data in different formats. What matters more is how disciplined you are in reading price action and managing risk.
A Renko chart plots price movement using fixed-size bricks and ignores time completely, filtering out minor price noise. A Western Bar Chart, on the other hand, is time-based and shows the open, high, low, and close for every fixed session.
A Point and Figure chart uses columns of X’s and O’s to show price reversals of a set size, also ignoring time. A bar chart plots every session in sequence with all four price points, giving a more detailed, time-based view of price action.Accordion Content
A line chart only connects closing prices, giving a simplified view of the overall trend. A bar chart shows the open, high, low, and close for each session, giving you a much more complete picture of what happened within that period.
On a Western Bar Chart, colour is often used only for visual styling and does not follow a standardised rule the way candlestick colours do. What actually matters is the position of the close relative to the high and low, and the size of the buying versus selling body
Start Reading the Market Like a Professional.
Let’s recap what you’ve learned today. A Western Bar Chart packs the open, high, low, and close of a session into a single bar. The relationship between the buying body and selling body tells you who was in control. Bullish, bearish, and neutral bars each tell a different story, and the close price — not the colour — is what really matters.
The sooner you start practicing on live charts, the sooner these patterns will feel natural instead of confusing. If you are serious about turning this knowledge into a consistent, confident trading skill, Yogesh Alim Share Market Academy is ready to guide you through every step — from your very first bar chart to your first confident trade.
Call/WhatsApp: 9167439076
https://yogeshalimacademy.in/
Your journey to reading the market like a professional starts with a single bar. Let’s get started.
Author Bio
Yogesh Alim
NISM Certified Research Analyst.
10+ years of live market trading experience..
6+ years of teaching experience.