
Complete Guide to Price Bar Analysis for Stock Trading
What is a Price Bar in Stock Trading?
Price bar is the basic building block of any stock chart. Every trader in NSE and BSE uses price bars daily. It shows four important prices – Open, High, Low, and Close (OHLC). Think of price bar as a complete story of one trading session.
In simple terms, price bar tells you everything that happened to a stock price during specific time period. Whether it’s 1 minute, 5 minutes, daily, or weekly – price bar captures all the action.
Understanding OHLC Data in Price Bars
Every price bar contains four crucial data points that form the foundation of technical analysis.Four data crucial points are Open Price,high price, low price and close price.
Price bar is the basic building block of any stock chart. Every trader in NSE and BSE uses price bars daily. It shows four important prices – Open, High, Low, and Close (OHLC). Think of price bar as a complete story of one trading session.
In simple terms, price bar tells you everything that happened to a stock price during specific time period. Whether it’s 1 minute, 5 minutes, daily, or weekly – price bar captures all the action.

Open Price
Open price is where stock started trading when market opened. For daily charts, it’s 9:15 AM price. For intraday price bar charts, it’s the first price of that time period.For 5 min. chart open price is the frist price of that five minute.1 hour chart open price is the frist price of that 1 hour.
High Price
High price is the maximum level stock reached during that period. For 5 min. chart high price is highest price reached during that five minute.1 hour chart high price is highest price traded during that 1 hour.This shows how bullish buyers were. Higher the high in a price bar, stronger the buying pressure.
Low Price
Low price is the minimum level stock touched during the price bar formation. For 5 min. chart low price is lowest price reached during that five minute.1 hour chart low price is lowest price traded during that 1 hour.This indicates selling pressure. Lower the low, more bearish the sentiment was.
Close Price
Close price is where stock ended that price bar time period. For 5 min. chart closed price is last traded price of that five minutes.1 hour chart close price is last traded price traded of that 1 hour and bar stoped printing price.This is most important price in price bar. It shows who won – buyers or sellers.
Types of Price Bars Used in Trading Markets
Candlestick Bars
Candlestick is most popular price bar format in India. Green price bar means close is higher than open (bullish). Red price bar means close is lower than open (bearish).
Japanese candlestick patterns work very well in Indian markets. Traders love them because price bar easy to understand visually.
Bar Charts (OHLC Bars)
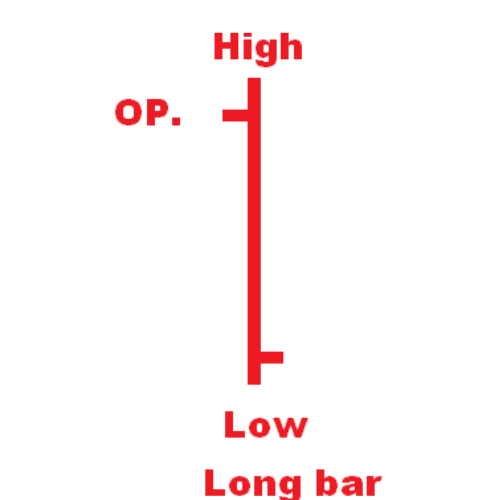
Traditional pricebar charts show thin vertical line with small horizontal marks. Left mark is open price, right mark is close price. Many old-school traders still prefer this price bar format.
Line Charts
Line charts only connect closing prices. They’re simple but miss important information like intraday highs and lows.
How to Analyse Price Bars for Trading
Successful price bar analysis requires understanding patterns and market psychology behind each formation.
Look for Price Bar Patterns
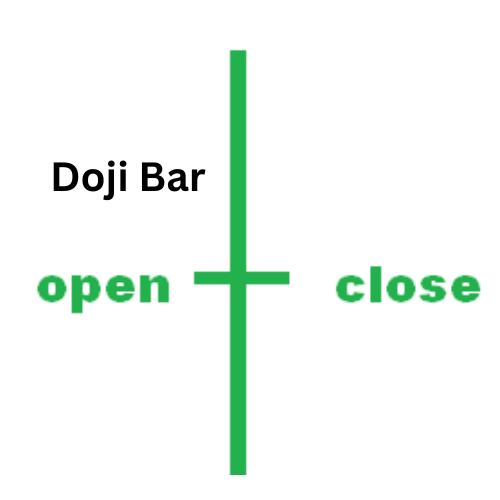
- Doji Price Bars: Open and close are almost at same price. Shows indecision in market.
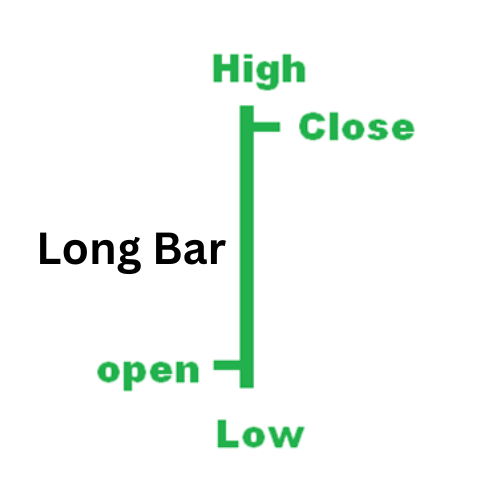
- Long Price Bars: Big difference between high and low.Ex. if High of 5 min is 104 and low is 103 then it is long bar becouse during five minuts share moved almost 1% peice range.It Shows strong momentum.
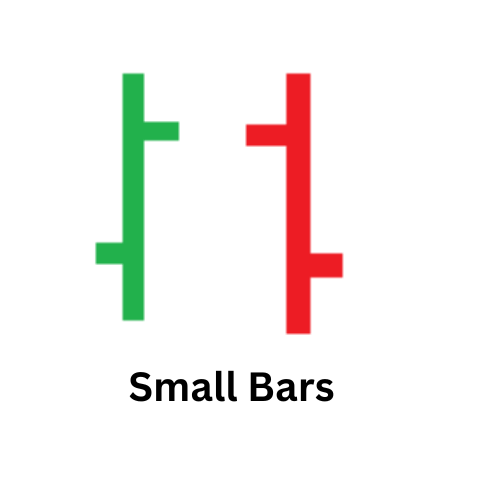
- Small Price Bars: Less volatility, market is quiet.Ex. If stock price is 100 and high is 100.30 and low price is 100.00 it will print small size price bar. and See images below.
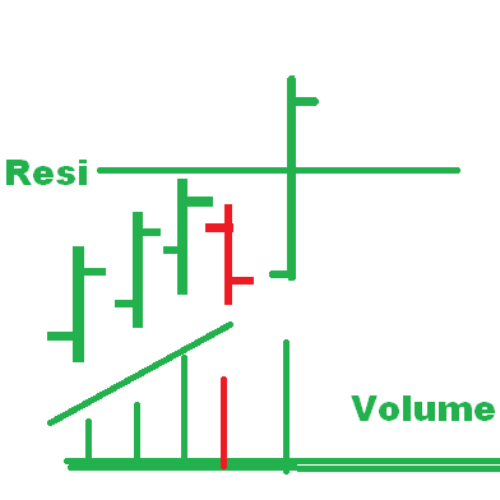
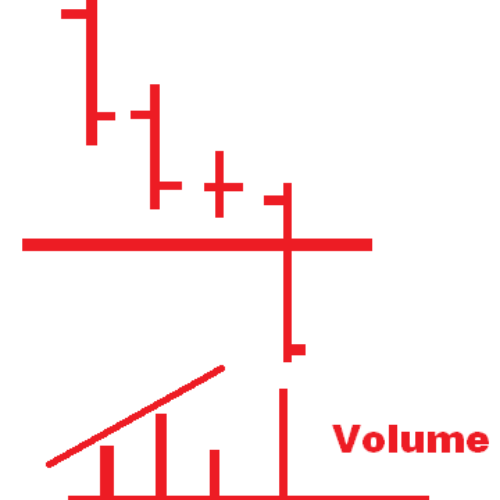
Check Volume with Price Bars
Volume tells you how many shares were traded. High volume with big price bar means strong move. Low volume with big price bar means weak move.
Check our course [Volume Price Analysis in Indian stock market]
Support and Resistance from Price Bars
Price bars create support and resistance levels. When multiple price bars fail to break a level, it becomes strong support or resistance.You can learn detail magic of support and resistace in our “Advanced Techanical Analysis Course“.
Price Action Trading Using Price Bars
Price action trading means making decisions only from price bars. No indicators needed. Many successful Indian traders use only price action.
Key Price Action Signals
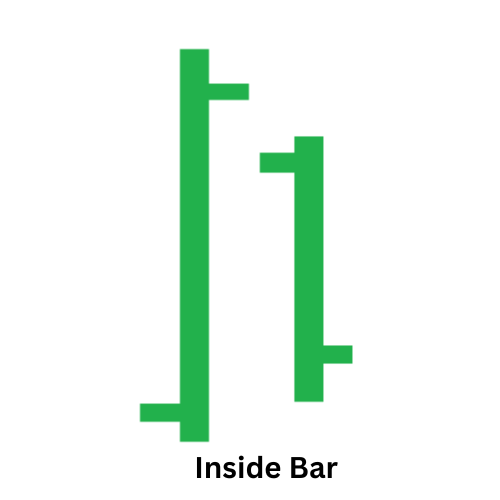
- Inside price bars: Current bar’s high-low is within previous bar’s range
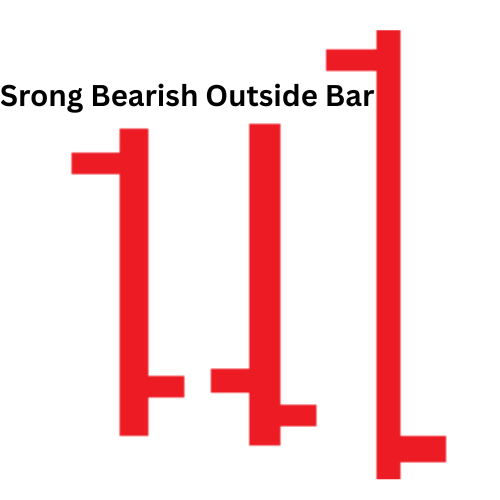
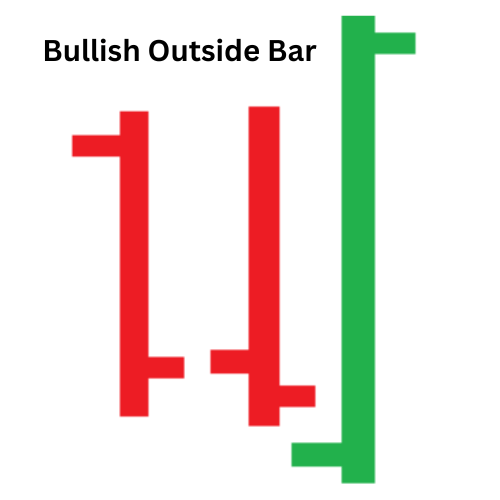
- Outside price bars: Current bar’s range is bigger than previous bar
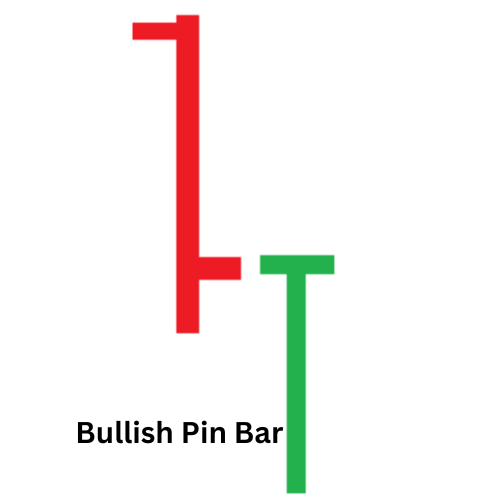
- Pin price bars: Long wick with small body, shows rejection
Price Bar Rejection Patterns
When stock touches important level but immediately reverses, it creates rejection pricebar. These are high-probability trading setups.
[Read- Price action trading strategies for Indian markets]
Time Frames for Price Bar Analysis
Intraday Price Bars
- 1-minute price bars: For scalping and very short-term trades
- 5-minute price bars: Most popular for day trading
- 15-minute price bars: Good for swing trades within day
Swing Trading Price Bars
- Hourly price bars: For positions held for few days
- Daily price bars: Most important for swing traders
- Weekly price bars: For long-term trend analysis.
Reading Market Sentiment from Price Bars
Each price bar formation tells a story about market psychology and trader sentiment.Think of each price bar as a mini-movie showing what happened during that time period. It captures the emotions, decisions, and actions of thousands of traders.
Bullish Price Bar Signals
- Series of higher highs and higher lows in consecutive price bars.
- Green candles with long bodies
- Breakout bars above resistance
Bearish Price Bar Signals
- Lower highs and lower lows pattern pattern in price bar sequence.
- Red price bar with long bodies.
- Breakdown pricebars below support. See images below.
Common Mistakes in Price Bar Analysis
Avoiding these common errors will improve your price bar analysis accuracy significantly.
Ignoring Context
Single price bar means nothing. Always look at surrounding price bars for context. What happened before and after each price bar matters a lot.
Overcomplicating Analysis
Keep it simple. Don’t try to find meaning in every small price bar movement. Focus on clear, obvious price bar patterns only.
Forgetting Time Frames
Same stock can be bullish on daily chart but bearish on hourly chart. Always check multiple time frames before trading.
Tools for Price Bar Analysis in India
Popular Charting Platforms
- Zerodha Kite: Free and user-friendly.You can open free demat account with Zerodha and use this platform free.
- TradingView: Advanced analysis tools.
Setting Up Price Bar Charts
Most platforms allow customization of price bars. You can change colors, add indicators, and set alerts based on price bar patterns.
Price Bar Strategies for Indian Markets
Gap Analysis
Indian markets often gap up or down at opening. Study how price bars behave after gaps for profitable opportunities.
Earnings Season Trading
During results season, price bars show extreme volatility. Learn to read post-earnings price bar patterns.
Sector Rotation
Different sectors show different price bar characteristics. IT stocks behave differently from pharma or banking stocks.
Risk Management with Price Bars
Stop Loss Using Price Bars
Place stop loss below/above significant price bar levels. This gives your trade room to breathe while limiting risk.
Position Sizing
Bigger price bars mean higher volatility. Adjust position size accordingly to manage risk properly.
Advanced Price Bar Concepts
Multiple Time Frame Analysis
Check monthly, weekly, daily, and hourly price bars before taking any trade. All should align for best results.
Price Bar Exhaustion
After long trending move, price bars become smaller and overlapping. This often signals trend exhaustion.
Conclusion
Price bar analysis is foundation of successful trading in Indian stock markets. Master the basics first – understanding OHLC data, recognizing patterns, and reading market sentiment.
Practice on paper before risking real money. Start with daily price bars, then move to shorter time frames. Remember, consistency beats complexity in trading.
Keep learning and adapting your price bar analysis to changing market conditions. Indian markets are unique, so develop strategies that work specifically for NSE and BSE stocks.If you are new in share market you can open free demat account with Zerodha with this link and take our 10 hour basic share market course absulatly free which will give confidence in trading.
Read Our Popular articlas: